How to Read Crypto Charts
As cryptocurrencies gain traction globally, interest in crypto investment continues to grow. Just as technical charts guide traders in equities and commodities, crypto charts are essential tools for making informed decisions in the dynamic world of digital assets.
Crypto charts visually depict historical price trends, trading volumes, and time intervals. By analyzing patterns formed from past price movements, traders can identify potential investment opportunities. A key type of chart used in crypto trading is the Japanese Candlestick Chart. Let’s dive deeper into how it works.
Japanese Candlestick Chart
One of the most popular tools for crypto traders, the Japanese Candlestick Chart provides vital information about price movements within a specific timeframe.
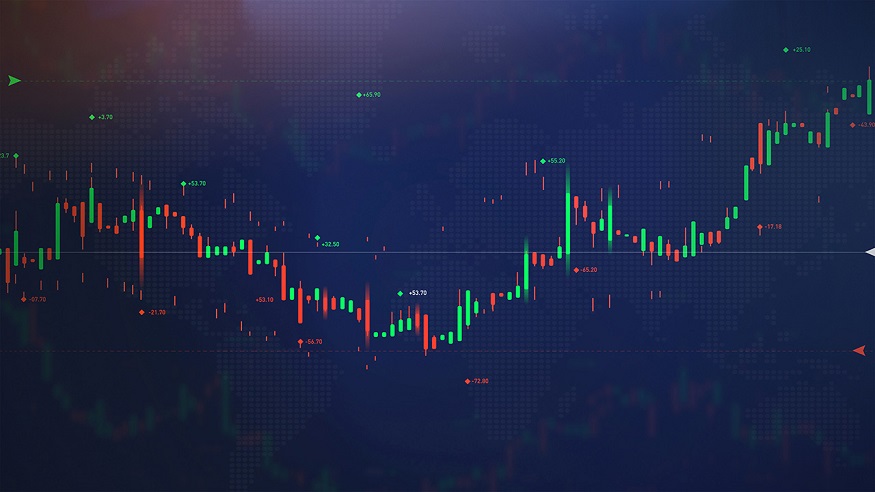
- Red Candles indicate that the closing price was lower than the opening price, signifying a price decline during the period.
- Green Candles show that the closing price exceeded the opening price, indicating an increase in value.
The size, color, and shape of each candlestick convey valuable insights into market sentiment, helping traders refine their strategies.
Bullish and Bearish Patterns
Crypto charts display two primary categories of patterns: Bullish Reversal Patterns and Bearish Reversal Patterns.
Hammer Candle Pattern (Bullish Reversal):
This pattern signals that an asset may be nearing the end of a downtrend. The candlestick resembles a hammer, with a short body and a long lower wick, indicating that sellers initially drove prices lower, but strong buying pressure led to a higher closing price. Traders confirm the bullish trend by monitoring subsequent trading sessions and checking for increased volume.Shooting Star Candle Pattern (Bearish Reversal):
This pattern typically appears at the peak of a rally before a downturn. It features a small body and a long upper wick, signaling that buyers pushed prices higher during the session, only to face resistance that drove prices back down.
Popular Patterns for Technical Analysis
Head and Shoulders
These reversal patterns signify the conclusion of an ongoing trend. At the peak of a trend, the standard "head and shoulders" pattern may appear, whereas an "inverted head and shoulders" emerges at the bottom of a trend. These patterns indicate a battle between buyers and sellers, ultimately resulting in a breakout or pullback.Wedges
Wedges form when price trends begin to consolidate. The market often oscillates within a narrowing range before making a decisive breakout in one direction.
Support and Resistance
Understanding support and resistance levels is critical for reading crypto charts:
- Support Level: This is the price level where an asset tends to stop falling due to increased buying interest.
- Resistance Level: This is the price at which an asset tends to stop rising as sellers outnumber buyers.
Traders often rely on these levels to decide when to enter or exit positions. Identifying these points can help you navigate the volatile crypto market more effectively.
By mastering these chart patterns and levels, you’ll gain a better understanding of market trends, helping you make smarter and more confident investment decisions in cryptocurrencies.
- Get link
- X
- Other Apps
- Get link
- X
- Other Apps
Comments
Post a Comment